画像:Gdp nominal and ppp 2004 world map.PNG
出典: フリー百科事典『ウィキペディア(Wikipedia)』

| このファイルはウィキメディア・コモンズから呼び出されたものです。 ページ・ノートへの記入や履歴などの詳細の確認はコモンズの画像説明ページ(ノート/履歴/ログ)を使用してください。 |
[編集]  ウィキメディア・コモンズの記述
[edit] Summary
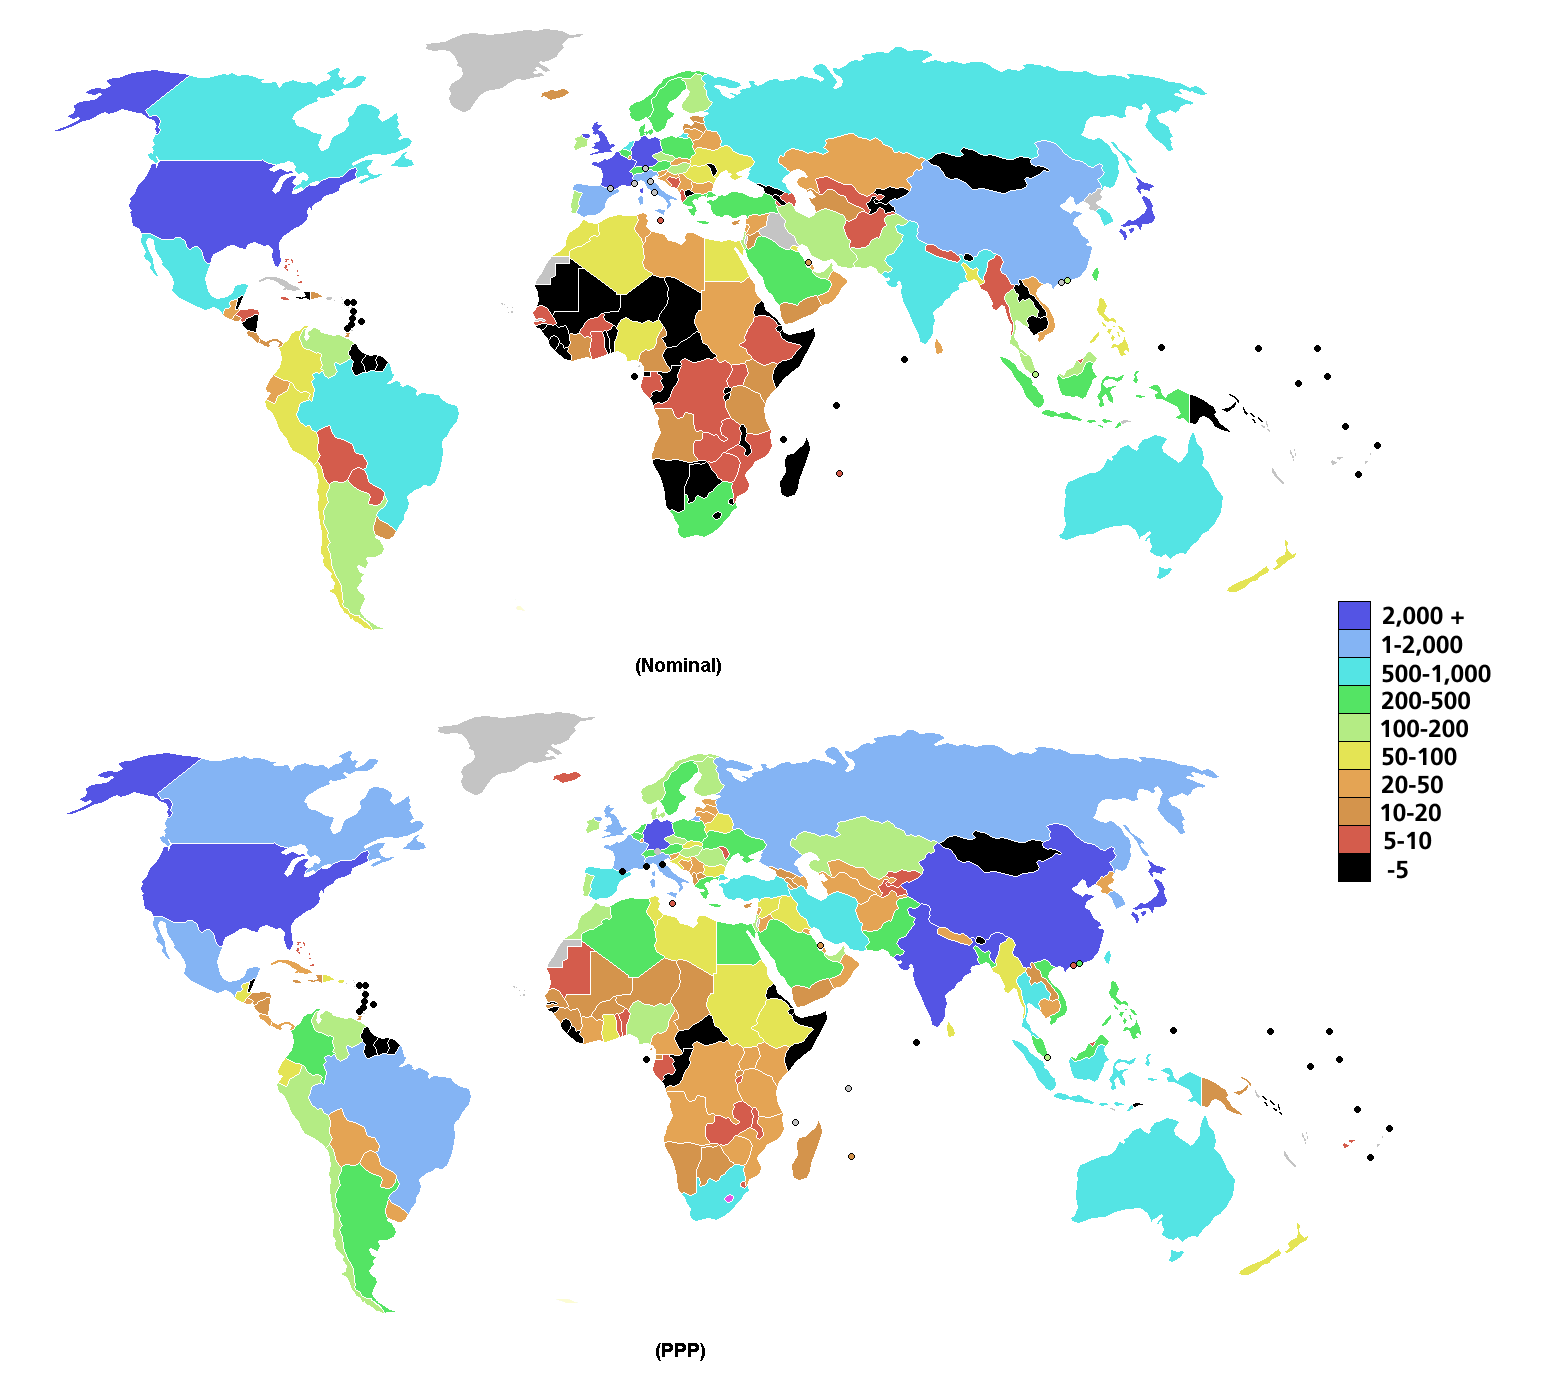
Comparison of IMF figures of GDP for 2004; top map is of nominal; bottom map is of Purchasing power parity. Numbers in billions of US dollars.
Map updated with 2005 map
[edit] Licensing
 |
Permission is granted to copy, distribute and/or modify this document under the terms of the GNU Free Documentation License, Version 1.2 or any later version published by the Free Software Foundation; with no Invariant Sections, no Front-Cover Texts, and no Back-Cover Texts. A copy of the license is included in the section entitled "GNU Free Documentation License".
العربية | Česky | Deutsch | English | Español | Français | Italiano | 日本語 | 한국어 | Nederlands | Polski | Português | Slovenčina | Svenska | עברית +/- |
リンク
この画像にリンクしているページの一覧:

