
Fil:CO2-417k.png
Frå Wikipedia – det frie oppslagsverket

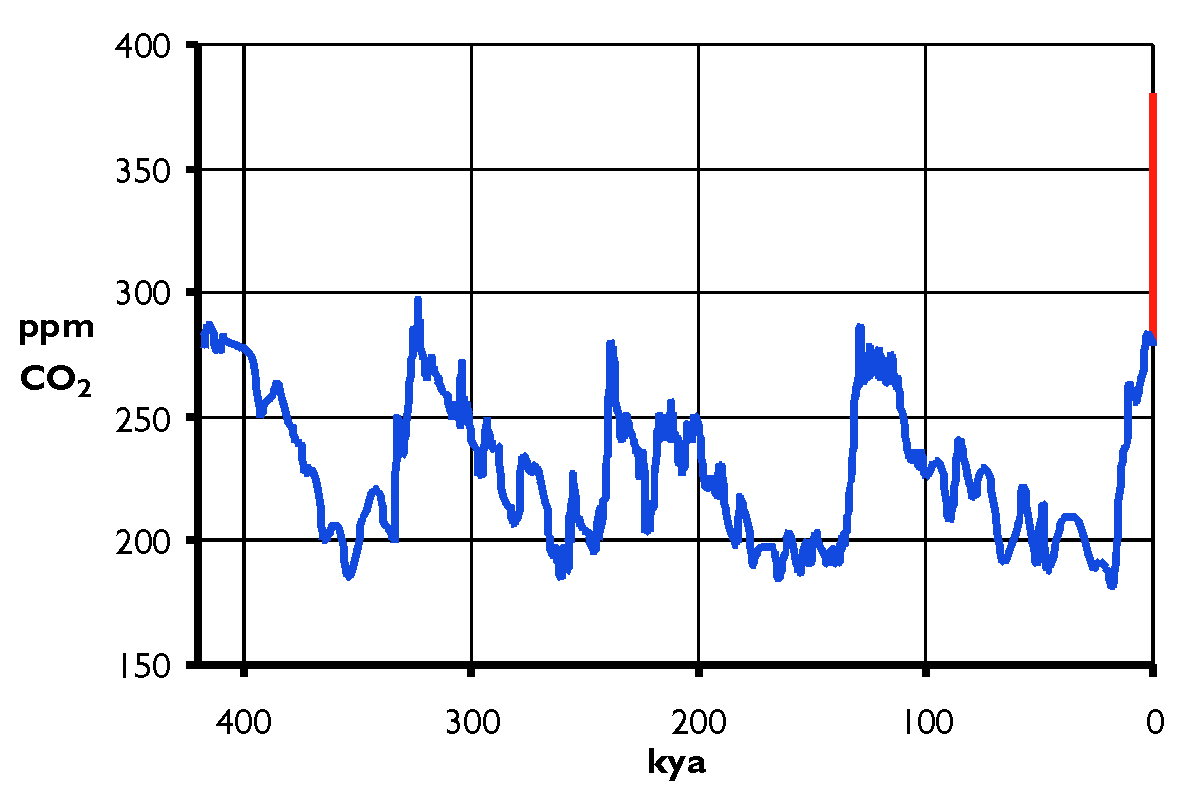
- Description: Atmospheric carbon dioxide concentration during the past 417,000 years (kya = one thousand years ago; i.e., present is at zero, right-hand side). Carbon dioxide levels are expressed as parts per million (volume). The blue part of the curve comes from historical carbon dioxide records from ice cores drilled at the Vostok station in Antarctica. The red part of the curve, on the other hand, illustrates the CO2 increase to 380 ppm between 1800 and today due to anthropogenic emissions from fossil fuels. This increase happened (and happens) on a time scale below the resolution (and outside the time frame) of the Vostok data. The values are taken from other sources instead (see Image:CO2-Temp.png and Image:CO2-Mauna-Loa.png)
- Source: graph drawn by Hanno using data published on the web by J.-M. Barnola, D. Raynaud, C. Lorius & N.I. Barkov (2003) as "Historical carbon dioxide record from the Vostok ice core". In Trends: A Compendium of Data on Global Change. Carbon Dioxide Information Analysis Center, Oak Ridge National Laboratory, U.S. Department of Energy, Oak Ridge, Tenn., U.S.A. [http://cdiac.esd.ornl.gov/trends/co2/vostok.htm]
- Licence: released per the GNU Free Documentation License by the originator
|

Fillenkjer
Dei følgjande sidene har lenkjer til denne fila:

